

Overview
Listed real estate is out of favour, not broken. The parallels with the late 1990s are hard to ignore: investors are crowded into technology, real estate is among the most underweight positions in the BofA Global Fund Manager Survey, and Asian REITs trade 10-20% below their long-run valuation averages. Meanwhile, the fundamentals are improving. Construction costs and higher rates have made new development uneconomic in most markets, rents are rising fastest where supply is tightest, and balance sheets are in far better shape than the market assumes. The last time the asset class was this unloved, it went on to deliver one of its strongest periods of relative performance.
Lessons from the Tech Bubble
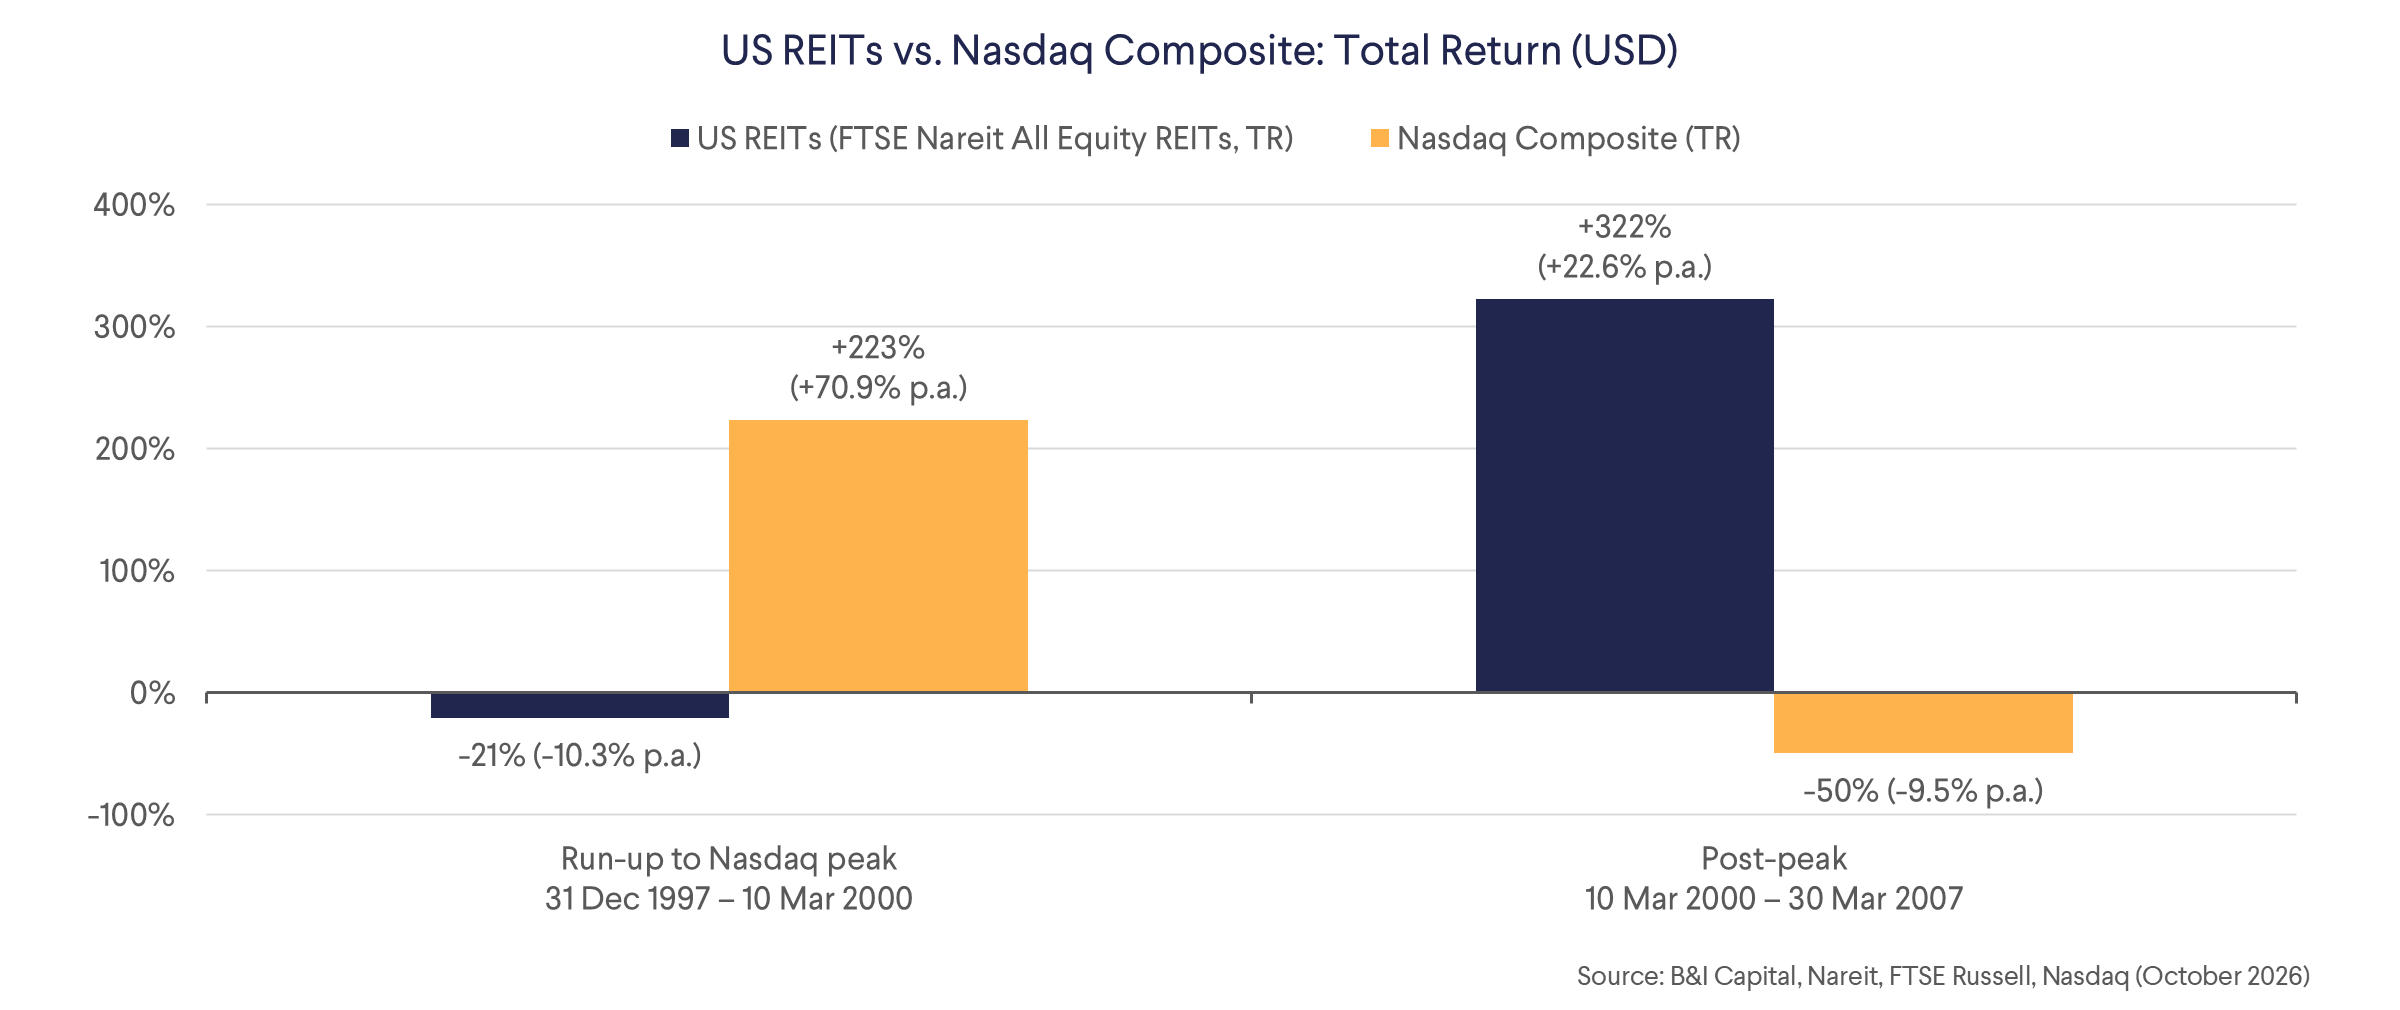
In the run-up to the Nasdaq peak, from December 1997 to March 2000, US REITs fell 21% while the Nasdaq Composite rose 223%. What followed was a complete reversal. From the Nasdaq peak on March 10th, 2000 to March 2007, US REITs returned 322% (22.6% p.a.) as the Nasdaq fell 50%. The comparison ends at the top of the REIT cycle, and REITs fell by roughly two-thirds into the March 2009 trough (GFC). Nor do REITs always win: from January 1998 to September 2026, the Nasdaq returned c.2,045% vs. c.817% for REITs. The lesson is about entry valuation. Buying the asset class when it is unloved has historically been rewarded.
Positioning and Valuation
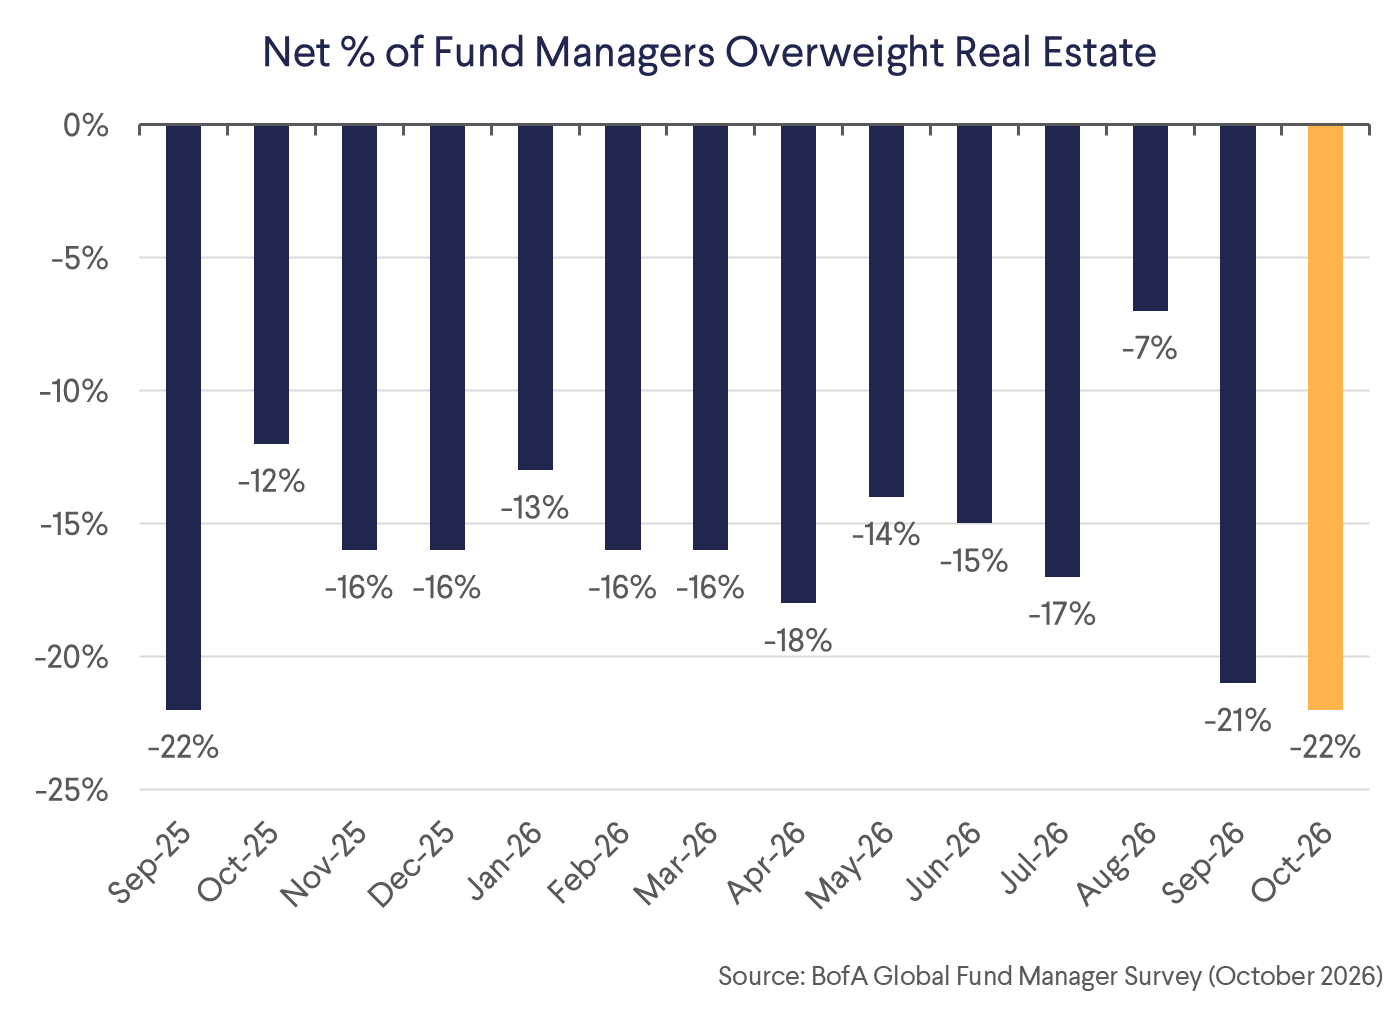
Fund managers are a net 22% underweight real estate in the October BofA survey, matching September 2025 and the largest underweight since August 2024, while technology is the most overweight position since 2020. Valuations tell a more mixed story. In Asia, REITs trade 10-20% below long-run averages: J-REITs at below 0.9x NAV vs. a long-run average of c.1.0x, and Australian, Singapore and Japanese REITs at c.0.85-0.9x book vs. c.1.05x. These are near the lows of the past decade. US REITs trade at a c.5% discount to NAV vs. a long-run average premium of c.5%, attractive but far shallower than the 20% discount of February 2000. The US yield gap is less supportive, with REIT yields 1.3ppt below the 10-year Treasury vs. a long-run average spread of +0.9ppt. Accordingly, we see the clearest valuation case in Asia.
| Valuation | Feb 2000 | Today | Long-run avg. |
|---|---|---|---|
| US REIT price vs. NAV | -20% | c.-5% | c.+5% |
| US REIT yield less 10-year UST | +2.3ppt | -1.3ppt | +0.9ppt |
| J-REIT price vs. NAV | n/a | <0.9x | c.1.0x |
| REIT price/book: AU, SG, JP | n/a | c.0.85-0.9x | c.1.05x |
Source: B&I Capital, Green Street, Nareit, UBS, Jarden, SMBC Nikko (October 2026)
New Supply Is Falling
Higher rates, tighter bank lending and costlier labour, materials and energy have made new development uneconomic at current rents. Existing landlords own assets that cannot be replaced at today's prices. In the US, new supply as a share of inventory falls again in 2026 and 2027 across Apartments, Industrial, Self Storage and Lodging, and senior housing starts remain low despite the demographic tailwind. Data Centers are the exception, where supply is still rising.
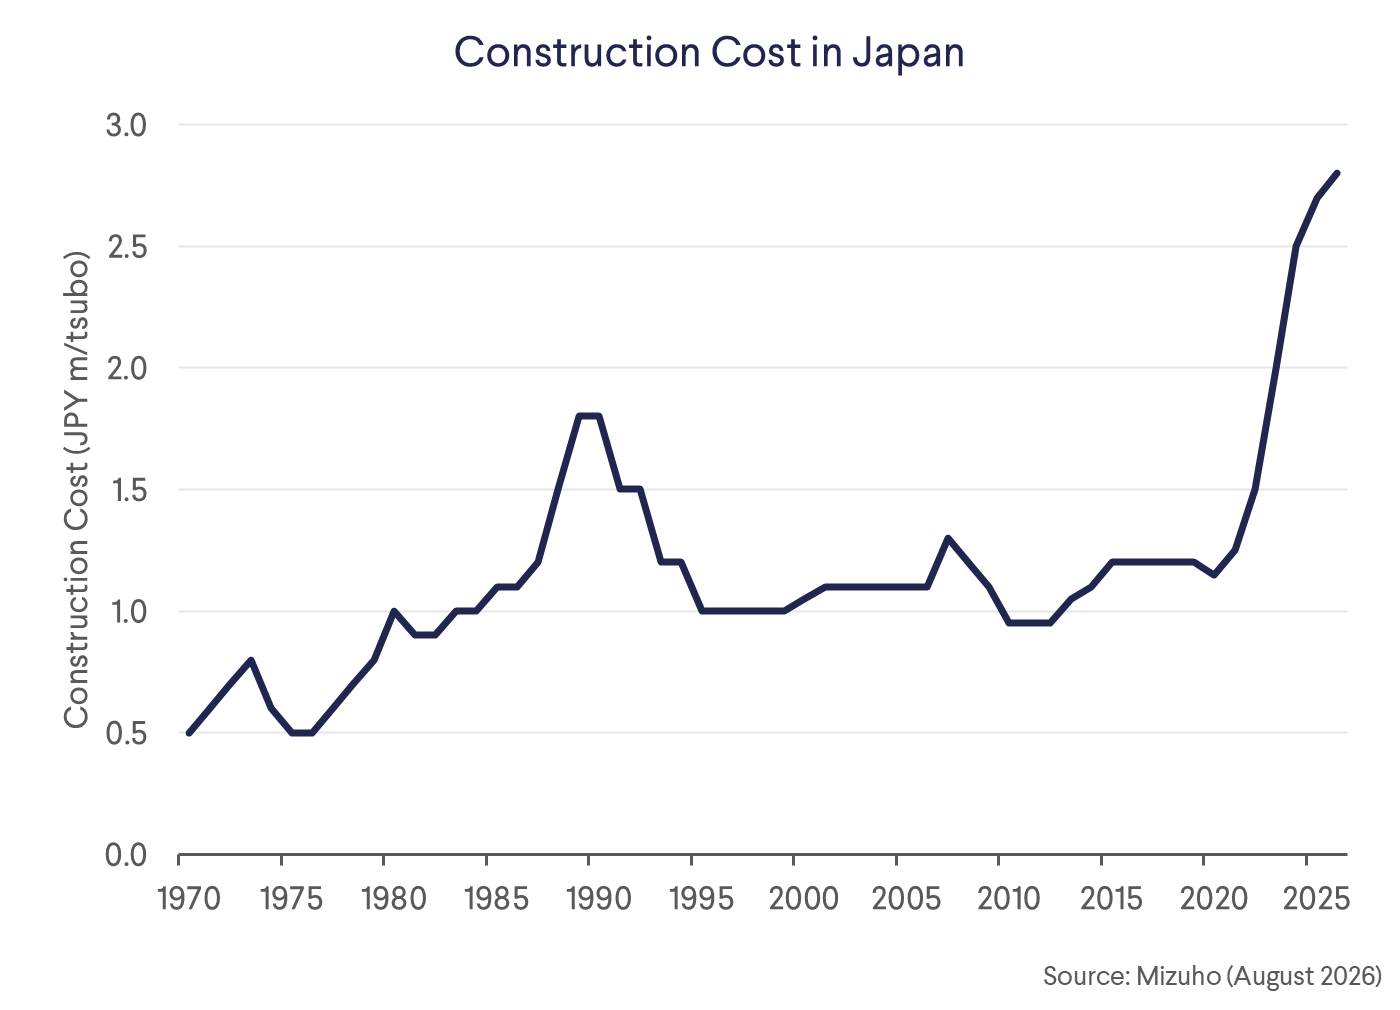
Japanese construction costs are the highest since 1970 and labour is short. New office, hotel and logistics developments are tapering, being delayed or cancelled, and rents must rise well above current levels before new supply pencils. In Japan logistics, new starts need rents of JPY 6,500+/tsubo vs. c.JPY 4,000 today just to cover build costs. Greater Tokyo logistics vacancy peaked at 9.6% and is now 7.1%, yet listed logistics REITs sit at 2.0%, and 95.6% of lease expiries at LaSalle LOGIPORT REIT (3466) were renewed at higher rents. Hotels show the same pattern. Japan received 42.6m visitors in 2025, 34% above 2019, with tourist spending at a record JPY 9.5tn, while new rooms in 2026-28 add only c.1% of stock a year vs. 3.4-3.6% in 2018-19.
Australian CBD office supply is at historic lows. Sydney face rents are c.30% short of what new development requires, so projects mooted for 2029 and beyond are unlikely to start. Vacancy is also more concentrated than the headline suggests, with 14% of Sydney and Melbourne CBD buildings holding 54% of vacant space.
Rents Are Rising Where Supply Is Tightest
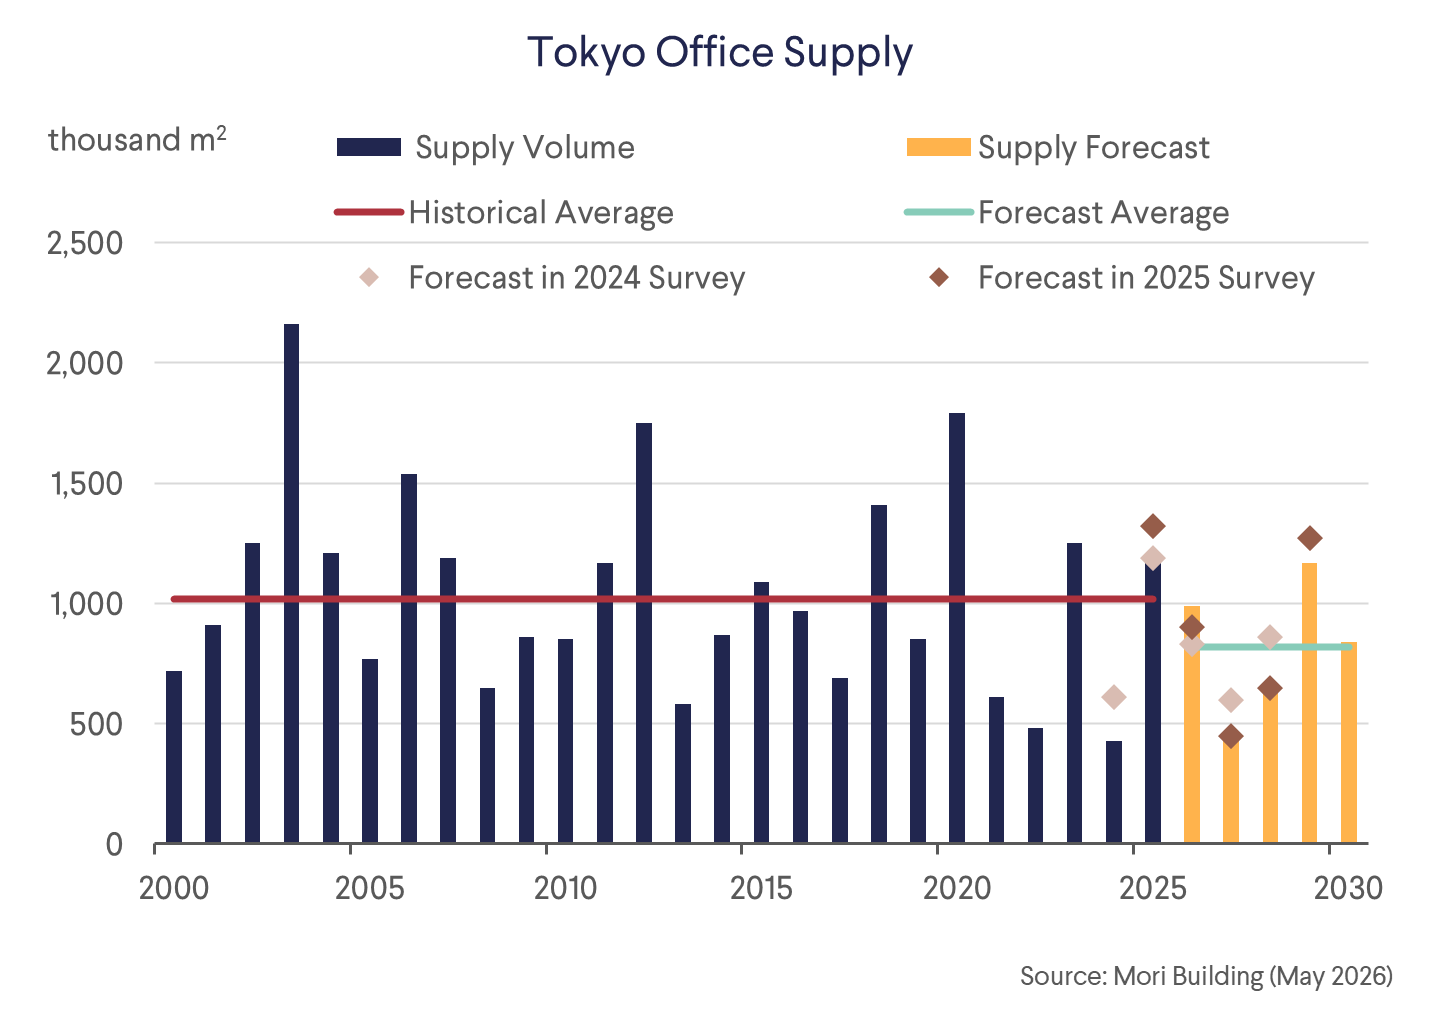
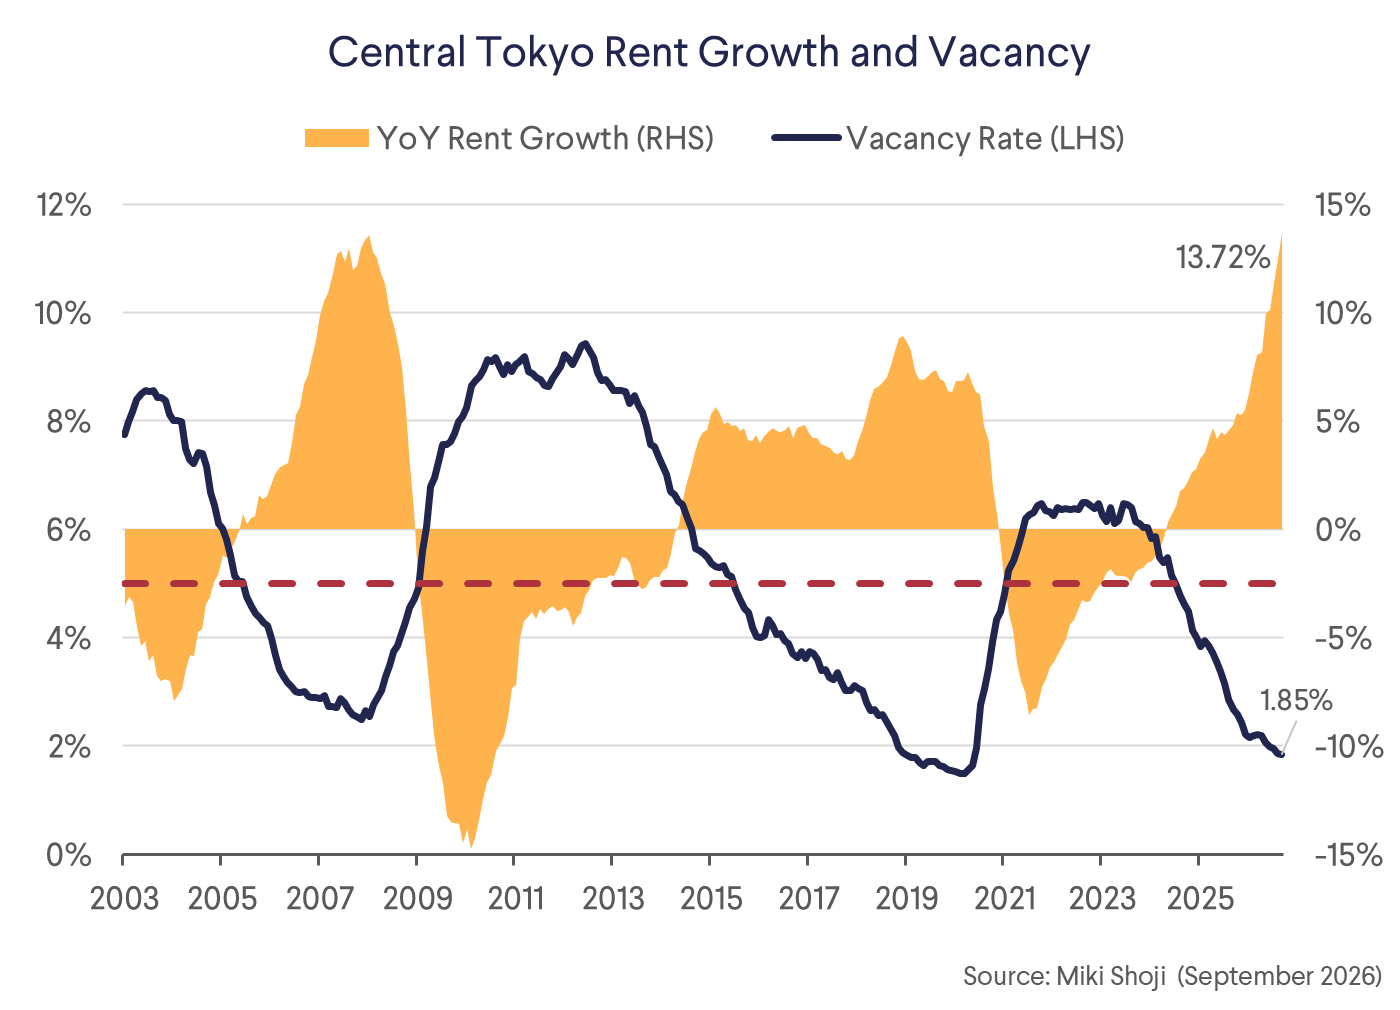
Tokyo office is the standout. Central Tokyo vacancy is 1.85% and rents are up 13.7% YoY, with limited supply through 2028. Strength is spreading from new prime towers across grades and locations, and Class A rents remain about half of New York and London on a like-for-like basis, at JPY 70,000/tsubo/month vs. c.JPY 145,000 and c.JPY 137,000, respectively. Mitsubishi Estate (8802) illustrates how rent growth outruns interest costs. Refinancing c.JPY 300bn of debt adds c.JPY 6bn of interest, c.2.5% of recurring operating profit, while Marunouchi alone, with vacancy below 0.5%, adds JPY 12.5bn of profit.
Hong Kong Central office has turned. Rents rose 3.3% QoQ in 2Q26, led by prime buildings. Grade A net absorption has been positive since 2024, helped by a 165% increase in IPOs in 2025 and hedge fund expansion, and Central adds little new space over the next six years. Rent growth is not universal, however. Australian and US Industrial rents have slowed.
Balance Sheets Are Not the Problem
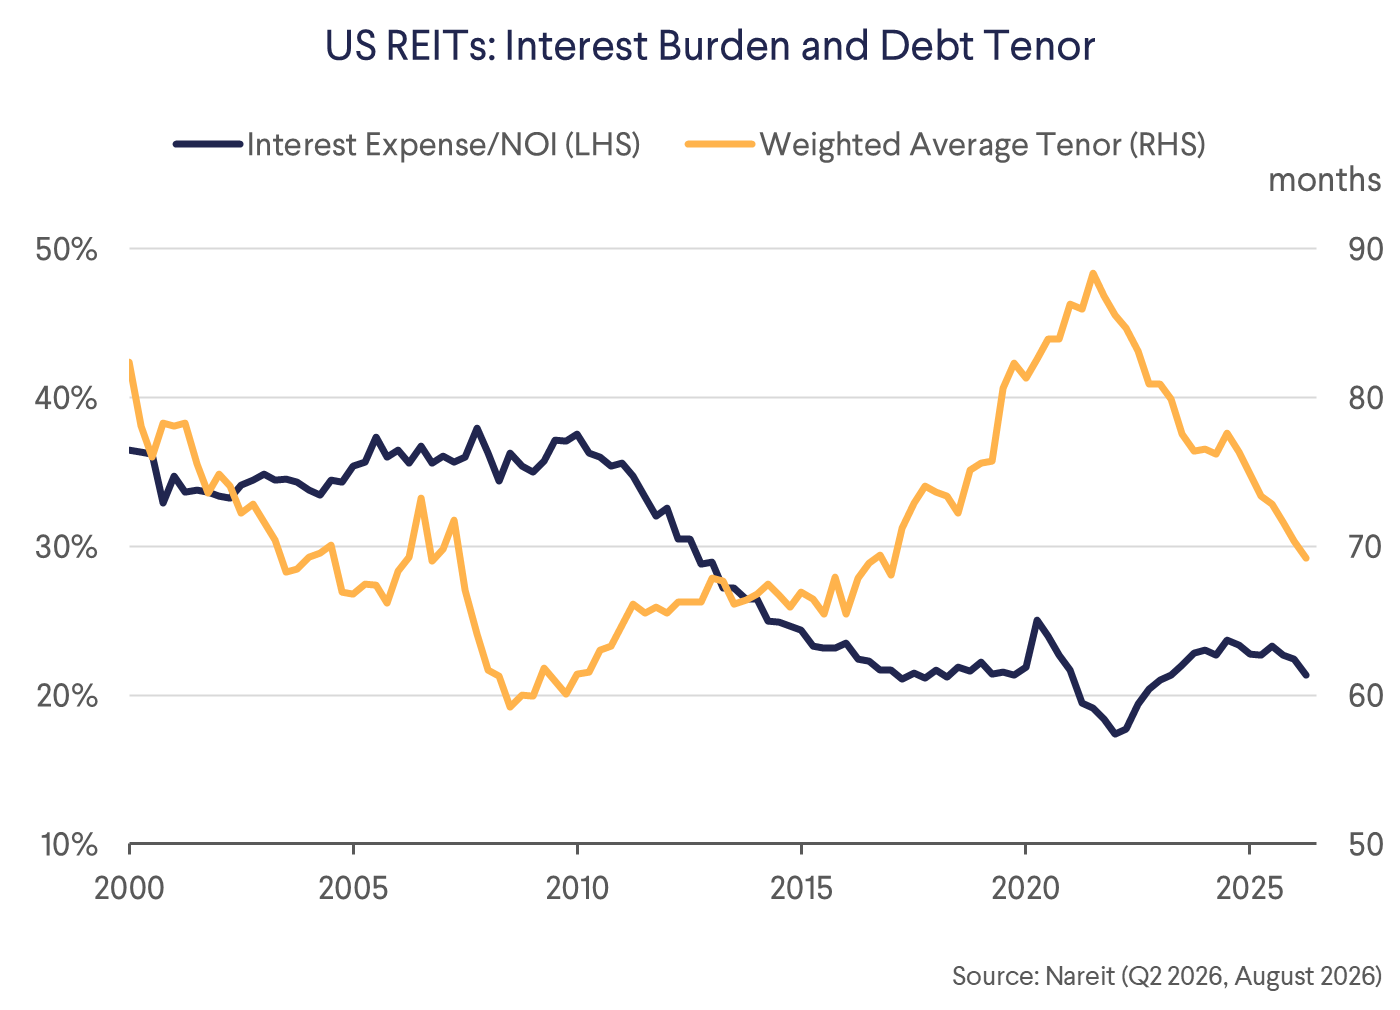
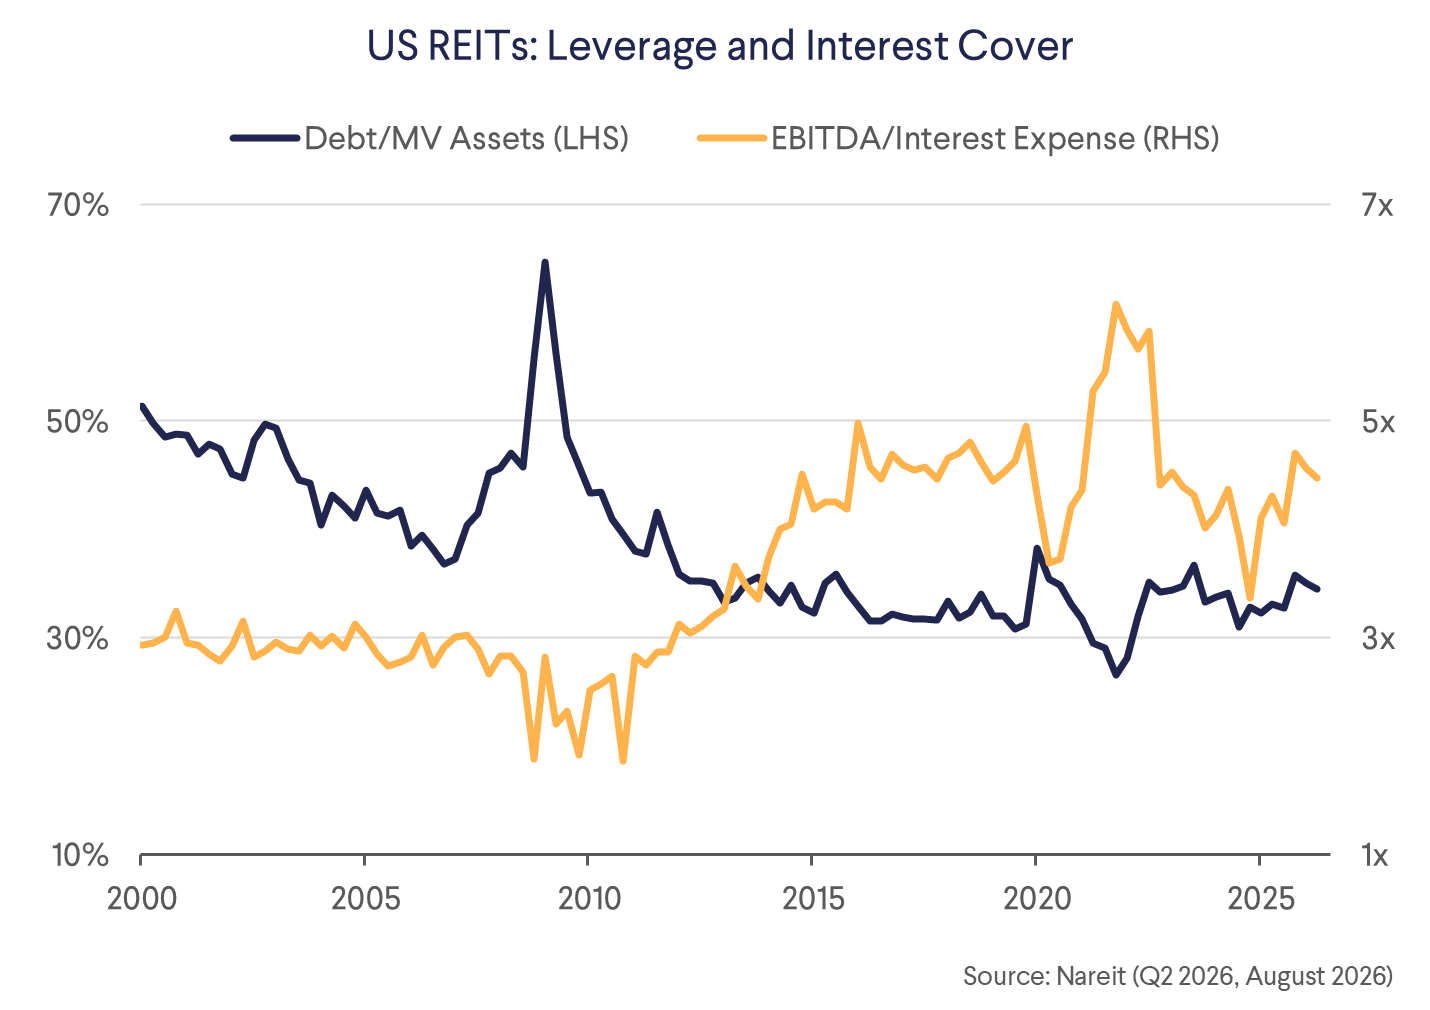
Debt ratios near historic lows, long tenors and high hedging mean higher rates filter through to earnings slowly. US REIT debt is 34.4% of market value with 4.5x interest cover (2Q26). Interest expense is c.22% of NOI vs. c.35% before the GFC, and the weighted average debt tenor is close to 70 months. Higher rates raise the cost of capital, but balance sheet risk is lower than the market fears.
Asia is similar. J-REITs have over 80% of debt fixed with average maturities of c.4 years, so a 100bps rise in rates costs c.8% of DPU in total but only c.1% per period, and LTV on appraisal value is c.36%, near a two-decade low. In Australia, a 50bps rise cuts FY27 earnings by c.1% for the A-REITs we track, vs. c.4% if their debt were unhedged. Bank margins are down 30bps in six months and Goodman (GMG) and Charter Hall (CHC) are geared below 20%. Singapore REITs are 79% hedged on average, and a 50bps rise cuts 2026 DPU by c.1-3%. With 3-month SORA at c.1.2% on strong capital inflows, funding costs are not the issue, and Parkway Life REIT's (PREIT) 16.6% DPU growth in FY26 far exceeds any increase in interest costs.
Conclusion
Investors are positioned as though listed real estate has a structural problem. The data says otherwise. Supply is falling because new development no longer pays, rents are rising where supply is tightest, and leverage is contained. Couple this with valuations 10-20% below long-run averages in Asia and the argument for a return to REITs is compelling. As in 2000, the entry point is what drives returns.
Download the PDF version of the presentation here